
UPDATE 10/1/2022: I found a better solution to running Glances persistently using a systemd unit file instead of nohup. I created new ansible automation to take advantage of this method. I will update this article accordingly in the near future.
There are many tools out there for monitoring the health of your infrastructure. None may be easier to set up and use than Glances. It can be installed quickly and works great as a replacement for traditional tools like top and htop - but did you know its metrics can also be exported to tools like Prometheus and InfluxDB for better visualizations and aggregations? If not, then here’s how I set up Glances to monitor all the servers in my homelab including my personal computers.
Assumptions
Before we get started there are a few assumptions this article makes:
- You have have
pipinstalled - You have a working Grafana instance
- You have a working Influxdb or Influxdb2 instance preferably influxdb2.
Installation
While there are several ways to install Glances depending on your system, I prefer to use pip since it can be made available almost anywhere. My preferred method of using pip is in a virtualenv but do what works best for you. Once you have python and pip setup then you can install Glances along with some dependencies we will use later:
1
pip install glances docker influxdb influxdb_client bottle
Once installed you can simple run glances in your terminal to get a view of your systems metrics in real-time. Pretty cool, but now let’s do the fun stuff.
Configuration
Glances does not require a configuration to work however we need to create one in order to access the additional settings. Create a glances.conf file somewhere and put it in a place that is easy to find. We’ll use a command line flag to point glances to our config file, but there are also places you can put it where glances will pick it up automatically depending on your system (refer to the docs for more info). Populate your config file with the sample config found here. Feel free to change the plugin settings as you see fit, the only thing I do is enable [connections] by setting disable=True.
Now that we have the config file populated, we’ll want to scroll down to the ‘Exports’ section. Under the [influxdb] or [influxdb2] sections, we’ll want to set the following parameters:
1
2
3
4
5
6
7
[influxdb]
host=192.168.86.1 # IP of your influxdb host
port=8086
protocol=http
user=root
password=root
db=glances # create a db named glances or use one you already have
1
2
3
4
5
6
7
[influxdb2]
host=192.168.86.1 # IP of your influxdb2 host
port=8086
protocol=http
org=homelab
bucket=homelab # create a bucket named glances or use one you already have
token=[insert your token here] # tokens are found under Data>Tokens within the Influxdb UI
Save and exit the file.
Deployment
Now let’s try running Glances to see if it works with our configurations:
1
2
3
glances -C [path to glances.conf] --quiet --export influxdb
# OR
glances -C [path to glances.conf] --quiet --export influxdb2
If you get a ModuleNotFound error then there is likely a dependancy missing. Using pip install the module referenced and try again.
Next, try checking your respective Influxdb instance, you should see metrics starting to come in like so:

Awesome stuff right. Now we could stop there except the minute we close our terminal the Glances process will be killed. The good news is that there is a command built into many Unix systems called nohup that can help us run Glances persistently. Let’s create a new file called glances_nohup.sh and add the following command:
1
nohup glances -C [path to glances.conf] --quiet --export [influxdb|influxdb2] >/dev/null 2>&1 &
Save and exit the file then run this command to make it executable:
1
chmod +x glances_nohup.sh
Finally, execute the file with:
1
./glances_nohup.sh
Depending on your system, you may see ouput in the form of a PID ID or you may see nothing. You can confirm the process is running using ps like this:
1
ps aux | grep glances
You should see output similar to this:
1
tbryant    58614  2.0  3.8 421320 118528 ?       Sl   Jun24 102:28 /home/tbryant/.pyenv/versions/3.10.2/envs/glances/bin/python3.10 /home/tbryant/.pyenv/versions/glances/bin/glances --quiet --export influxdb --export influxdb2
In this case, 58614 is our PID ID - if for some reason we want to stop the process then we simply kill it with:
1
kill 58614
If all goes well, you should be able to return to Influxdb and see your metrics coming in again. Now when you exit your terminal the Glances process will persist and continue to export metrics. Please note, if you reboot the server then you may need to run the shell script again to restart the process.
Visualization
Visualizing the metrics from Influxdb is fine, but Grafana is even better. If you have Grafana then you can add or update your Influxdb data source so the Glances metrics become available. I’m not going to discuss how to setup Grafana here but your data source should look something like this:

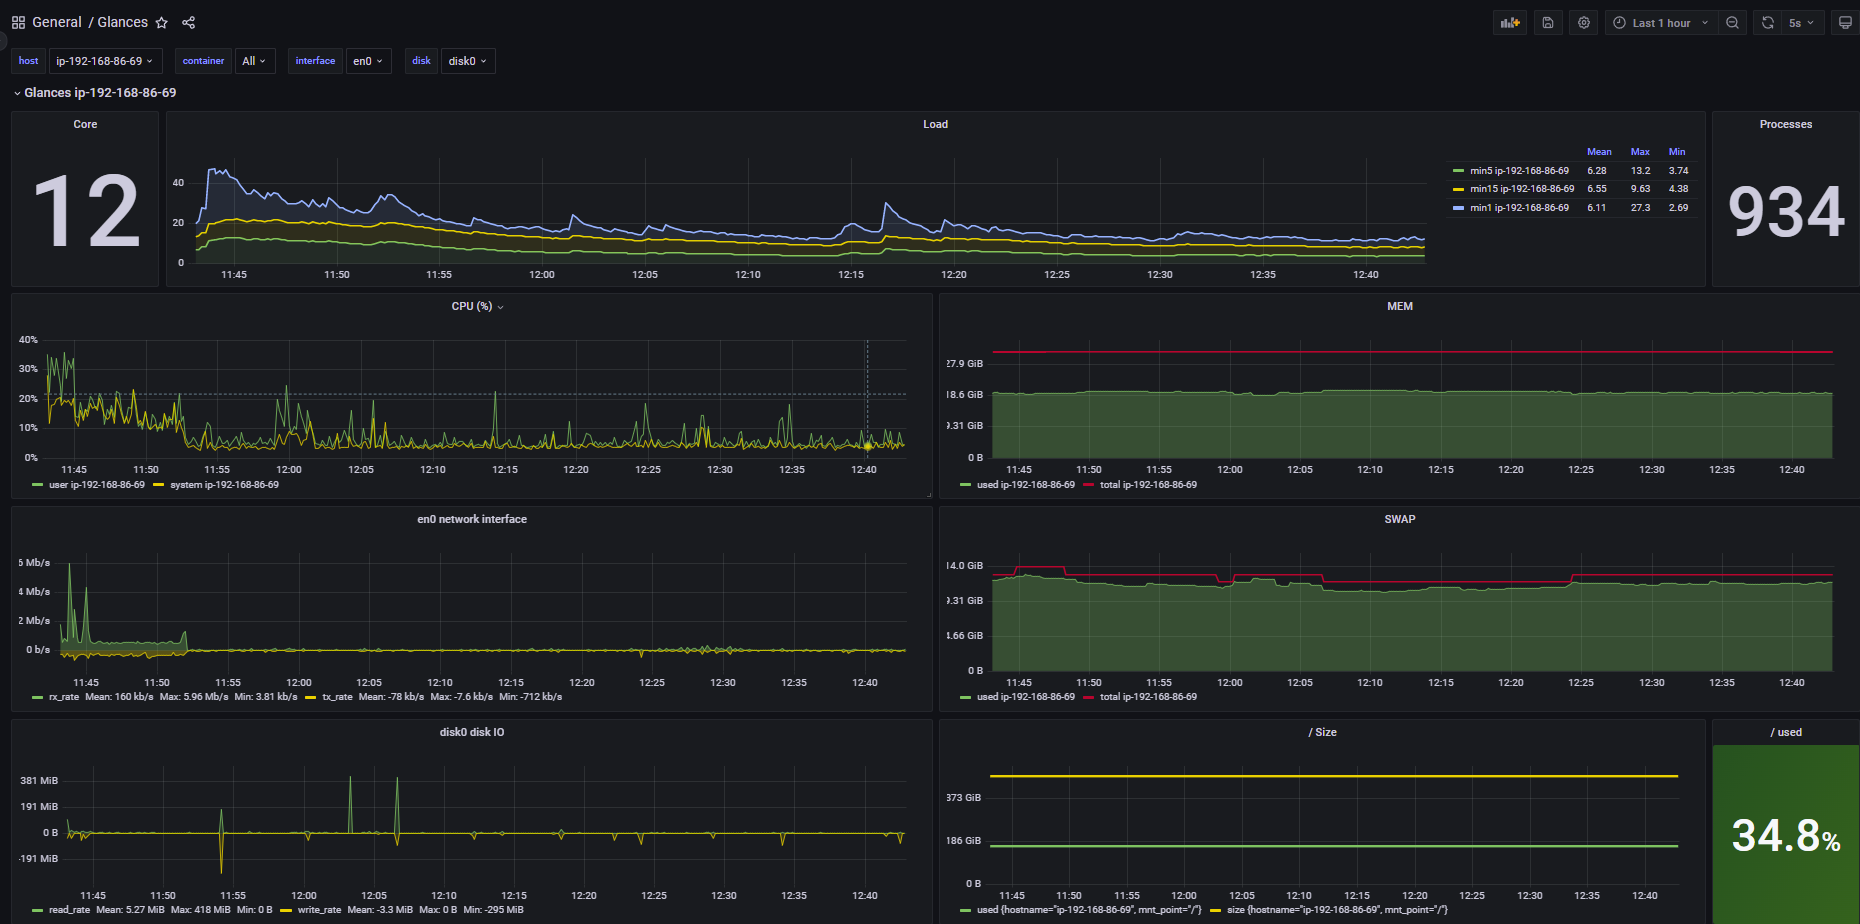
Assuming you have the data source set up correctly, and are using Influxdb2, then there is a pre-built dashboard that can be imported to immediately start visualizing our metrics. From Grafana, hover over the dashboards icon on the left-hand side and select ‘Import’. In the import screen enter the following ID 2387. Load the dashboard and be sure to select the correct datasource - if all goes to plan you should see your Glances metrics displaying on an insightful dashboard:
 If you’re using Influxdb and not Influxdb2, then you can try importing the JSON provided on the Glances documentation site found here Influxdb and Grafana.
Automation
We discussed how to configure Glances on a single server, but what if you want to monitor more than one or even a bunch. You could do it manually like we did here or you could set up some sort of automation to do it for you. There’s many ways to automate something like this and I don’t want to go into too many details now but I did want to mention it as a possibility. Personally, I’ve set up Ansible scripts that I run on any new server I provision. As part of the Ansible playbook, I’ve created a Glances role I use whenever I want to install it on a server. The role mostly just installs Glances, copies the config and run script over to the new server, and then runs Glances. I’m working to make it a bit more “dynamic” but for example purposes here are the tasks as they stand now:
1
2
3
4
5
6
7
8
9
10
11
12
13
14
15
16
17
18
19
20
21
22
23
24
25
26
27
28
29
30
31
32
33
34
35
36
37
38
39
40
41
42
43
44
45
46
47
48
49
50
51
52
---
# tasks file for glances
- name: Create glances directory
  become: true
  become_user: ""
  file:
    path: /home//glances
    state: directory
    mode: 0700

- name: Create glances virtualenv
  become: true
  become_user: ""
  shell: ""
  with_items:
    - cmd: /home//.pyenv/bin/pyenv virtualenv  glances && /home//.pyenv/bin/pyenv local glances
  args:
    chdir: /home//glances
    creates: "/home//.pyenv/versions/glances"

- name: install glances dependencies
  become: true
  become_user: ""
  shell: ""
  with_items:
    - cmd: /home//.pyenv/bin/pyenv exec pip install glances docker influxdb influxdb-client bottle
  args:
    chdir: /home//glances

- name: Copy glances config onto server
  become: true
  become_user: ""
  copy:
    src: /Users/timothybryant/DevOps/ansible/ansible-ubuntu-scripts/provisioning/configs/glances.conf
    dest: $HOME/glances/

- name: Copy glances run script onto server with proper permissions
  become: true
  become_user: ""
  copy:
    src: /Users/timothybryant/DevOps/ansible/ansible-ubuntu-scripts/provisioning/configs/glances_nohup.sh
    dest: $HOME/glances/
    mode: "0777"

- name: run glances
  become: true
  become_user: ""
  shell: ""
  with_items:
    - cmd: ./glances_nohup.sh
  args:
    chdir: /home//glances
Closing
And that’s how I use Glances to monitor the infrastrucuture resources of my servers. I even install Glances on my personal computers like my macbook. If you run things in docker containers like I do, then Glances can also collect metrics on those. We already installed the docker dependancy at the start and its enabled by default in the configuration so nothing else is really needed to see those metrics. Grafana allows you to create alerts which I use so I know if any of my servers are experiencing resource constraints. We’ve only scratched the surface here and I encourage those interested to check out the Glances docs.
Next up
Glances can also be used to monitor Windows PC’s but doing so can be a bit tricky, ecspecially if you want it to run persistently. I’ll be creating a seperate post where I show you how I set up Glances to run persistently on my gaming pc using a tool called NSSM - so look out for that!